
Latency engineering
Why LLM latency isn't a single number: the waterfall, TTFT vs total time, parallel tool calls, prefix caching, and the perceived-latency tricks that close the gap UX-side.
A user types a question into your chat product. Three seconds of blank screen. They retry. Then they leave.
The temptation is to call this "the model is slow" and reach for a faster model. That misses the actual cause about half the time. "LLM latency" isn't a single number. It's a waterfall of five distinct stages, each with different bottlenecks, different fixes, and different relationships to what users actually feel.
This chapter is about decomposing the waterfall, picking the right metric (it's not what you think), and applying the optimizations that target the right stage.
The waterfall#
Every LLM request decomposes into five additive stages:[1]
TTFT = T_network + T_queue + T_tokenization + T_prefill
E2E = TTFT + (TPOT x output_tokens)- Network ingress (T_network): transit from client to inference server. 5-30 ms regional, 80-220 ms cross-continental.
- Queue wait (T_queue): time waiting for a GPU batch slot. Near zero at low load, dominant under high concurrency.
- Tokenization (T_tokenization): CPU-side conversion of text to token IDs. About 10 ms for 1K tokens.
- Prefill (T_prefill): GPU forward pass over all input tokens. Compute-bound. Each input token adds roughly 0.24 ms to TTFT P95 on GPT-4 Turbo via Azure PTU.[2]
- Decode (TPOT): memory-bandwidth-bound. One forward pass per output token. Sets streaming throughput.
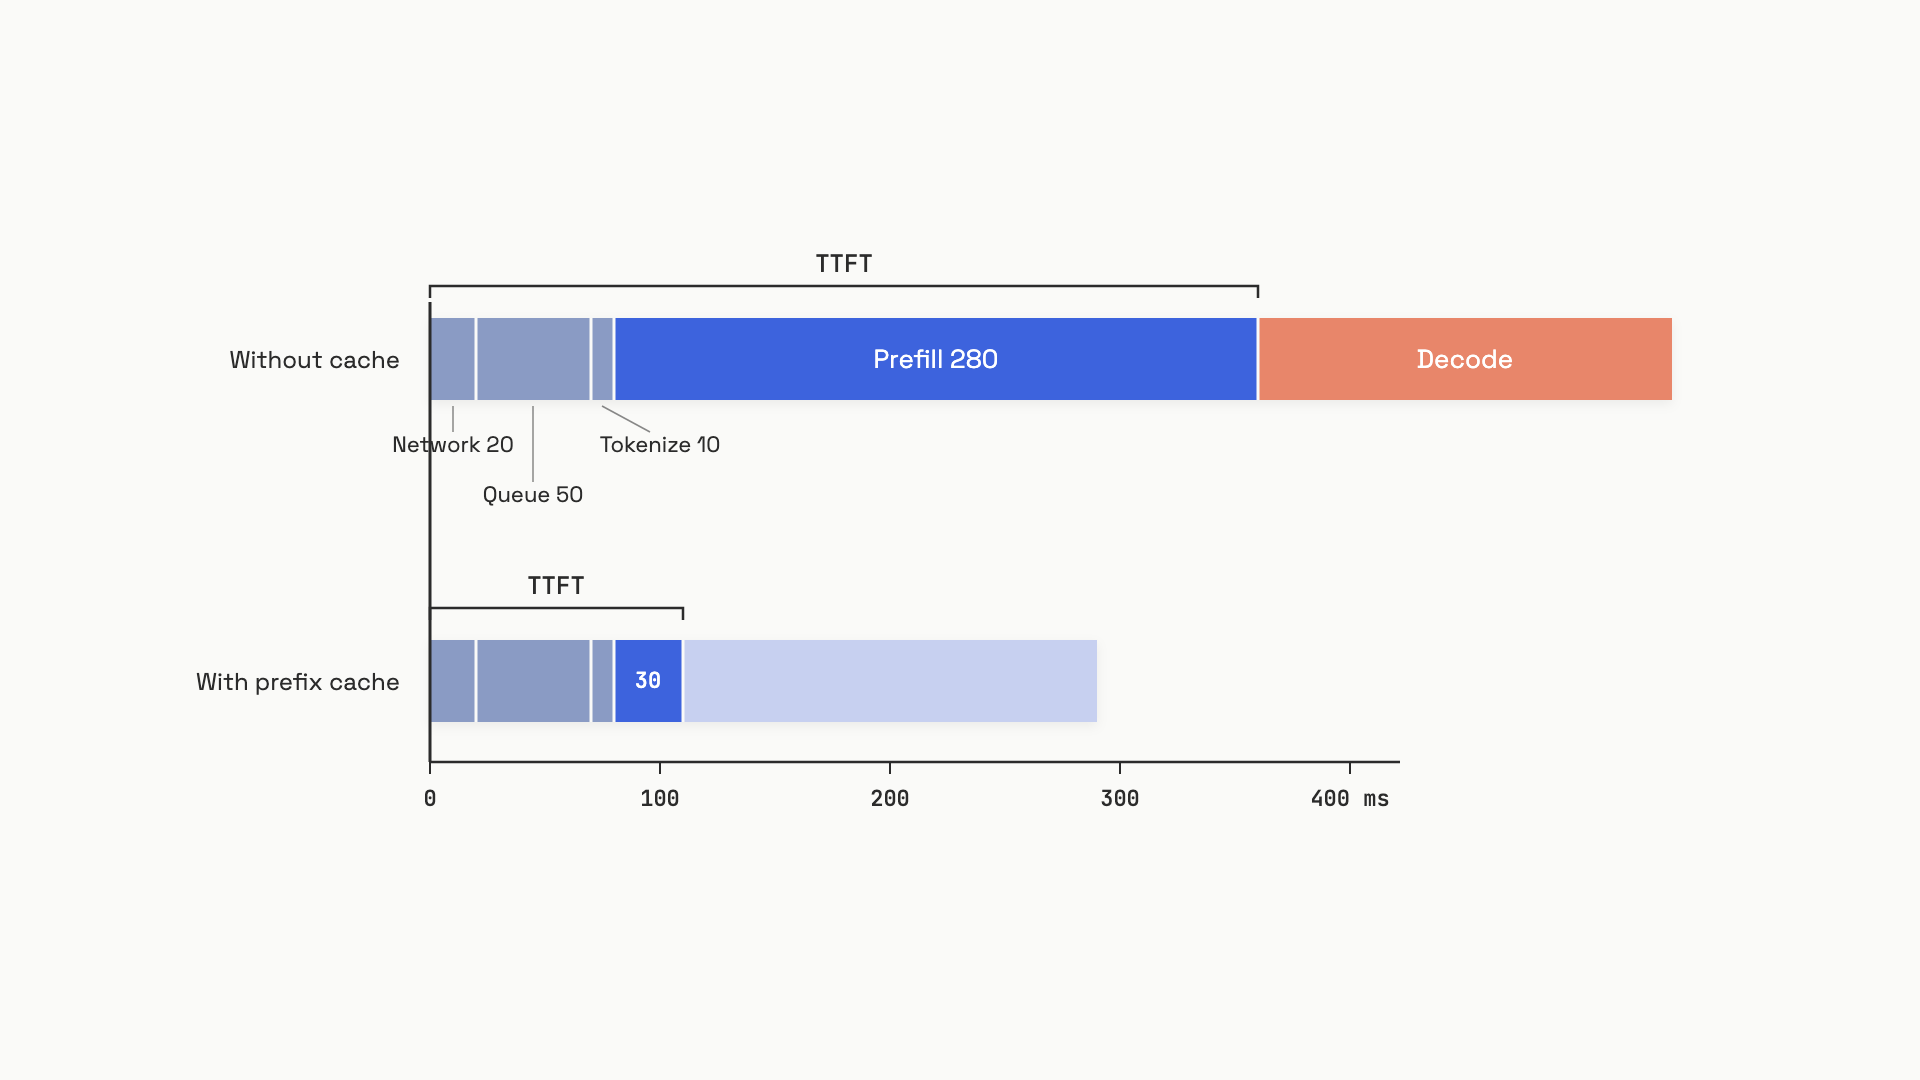 The same request, with and without prefix caching. Prefill dominates TTFT for any non-trivial prompt, which is why caching is the single highest-leverage lever.
For a 400 ms TTFT P99 budget on H100 SXM5 with a 1,024-token prompt: roughly 20 ms network, 50 ms queue, 10 ms tokenization, 280 ms prefill.[1:1] Prefill dominates. That's why prompt length and prefix caching are the two biggest TTFT levers.
Queue is the hidden variable. P99 queue wait scales as roughly 1/(1 - utilization) under M/M/1 dynamics. At 80% utilization, P99 tail latency runs 5x worse than at 20% utilization. That's the math behind a working SLO rule: trigger autoscaling at 60-70% utilization, never 80%.[1:2]
TTFT is the metric that matters#
If you remember one thing from this chapter, it's this: tokens-per-second is not the user-facing metric. TTFT is.
The reasoning starts with the NNGroup three-limits model from 1968 (Miller) and refined by Card et al. in 1991. Three perception thresholds, stable for 50+ years:[3]
- Under 100 ms. Feels instantaneous. Direct manipulation.
- 100 ms to 1 second. User notices the delay but flow is uninterrupted.
- 1 to 10 seconds. User must actively wait. Progress indicator required.
- Over 10 seconds. Attention wanders. Disengagement.
Applied to LLM chat: TTFT under 500 ms feels responsive, 500 ms to 1 second is acceptable, 1 to 2 seconds registers as slow, over 2 seconds causes abandonment.[4]
Why streaming alone doesn't fix a slow TTFT: streaming masks latency after the first token. A system with 2.5 s TTFT followed by fast streaming gives users 2.5 seconds of blank screen before they see anything. Users perceive that as slower than a system with 400 ms TTFT followed by slower streaming, even when total end-to-end is longer.[4:1]
Reasoning models break this entirely. Extended thinking on Claude Opus 4.7 produces a 28-second TTFT P50 at max thinking budget; GPT-5.5 Pro at high reasoning effort hits 67 seconds.[5] For interactive UX, reasoning mode isn't a slower variant. It's a different latency category, and you should design it as a background async task, not as a chat reply.
The second pitfall: don't track averages.
Track P50, P95, P99 separately. A 200 ms P50 can coexist with a 3-second P99, which means 1% of your users wait 15x longer than the average suggests. The P99/P50 ratio averages 2.1x across providers and reaches 3.2x for the worst pairings.[5:1] Size capacity against P99 at expected peak concurrency, not P50 at average load.
The other common mistake: benchmarking at one concurrent user. That number includes no queue and no batch interference. It's useless for sizing. Always measure at expected P95 concurrent request count.
Where the milliseconds actually go#
Default TTFT P99 targets by UX class, as of mid-2026:[1:3]
| UX class | TTFT P99 budget | ITL P99 budget |
|---|---|---|
| Real-time voice | 150 ms | 30 ms |
| Inline code autocomplete | 100 ms | 25 ms |
| Chat / interactive | 300 ms | 50 ms |
| RAG-augmented chat | 400 ms | 80 ms |
| Background agentic | 3,000 ms | 200 ms |
These targets dictate model and provider choice more than capability does. Sub-300 ms TTFT is realistically only achievable through Groq LPU (P50 ~0.18 s on Llama 4 405B) or Cerebras wafer-scale (P50 ~0.16 s on Llama 4 70B).[5:2] Frontier closed-source models (Claude Opus 4.7 standard, GPT-5.5 standard, Gemini 3 Pro) hit 0.85-1.12 s P50, which is fine for chat but not for autocomplete. Cursor's IDE autocomplete routes to Groq specifically because the 100 ms budget rules out anything else.
The decision rule: choose the model and provider for each UX class separately. The same product can use Groq for inline completion and Claude Opus for the panel chat, because they're different latency budgets.
Prefix caching is the single highest-leverage TTFT lever#
Prefill dominates TTFT for any prompt longer than a few hundred tokens. Cutting prefill is the largest practical win, and the way to cut prefill is to skip computing tokens you've already computed.
Glean published the measurement: each cached input token saves about 0.15 ms of prefill on GPT-4 Turbo Azure PTU.[6] Caching 1,000 tokens saves roughly 100 ms TTFT. Glean's production system saw TTFT drop from 4.3 seconds to 0.6 seconds on cache-warm requests, a 7x improvement with no model change.[7]
To exploit prefix caching, structure prompts so common content (system prompt, tool schemas, few-shot examples, document context) lives at the front, and per-request variable content (user ID, timestamp, current query) lives at the end. The cache key is a hash of the prefix up to the first differing token. One byte of variation in early tokens invalidates the entire downstream cache.
[system prompt] -> [tools] -> [few-shot examples] -> [document] -> [user query]
        cacheable                               variable
The pitfall: enabling prefix caching without measuring the hit rate. Teams ship the feature, see no improvement, and don't know why. The fix is the same as for the previous chapter's caching lever: instrument cache_read_input_tokens and watch it go non-zero.
For deeper coverage of provider-specific caching, see Prompt caching.
Parallel tool calls#
In agentic pipelines, tool execution accounts for 35-60% of total agent latency.[8] When a model emits multiple tool_use blocks in one response turn, the right pattern is to dispatch them concurrently and return all results in a single user message before the next inference step.
The arithmetic is straightforward: three independent 200 ms tool calls take 600 ms sequentially or 200 ms in parallel. The LLM-Tool Compiler paper measured up to 4x more parallel calls than baseline methods on a Copilot-class platform, reducing latency by up to 40%.[9]
import asyncio

async def dispatch_parallel_tools(tool_uses: list) -> list:
    """Execute all tool_use blocks from one model turn concurrently.
    Wall-clock cost = max(individual latencies), not sum.
    All results returned in a single list for inclusion in ONE user message.
    """
    async def run_one(block):
        result = await TOOL_REGISTRY[block["name"]](**block["input"])
        return {"type": "tool_result", "tool_use_id": block["id"], "content": result}

    return await asyncio.gather(*[run_one(b) for b in tool_uses])
There's one critical message-history rule on the Anthropic API: all tool results from a parallel batch must be returned in a single user message, not split across multiple messages.[10] Splitting them trains the model to stop issuing parallel calls in subsequent turns.
The failure mode worth knowing: hidden coupling.
When you parallelize tool calls, you reveal dependencies that sequential execution masked. Three categories all surface as wrong answers, not as exceptions:
- Context dependency. Tool A reads a shared variable Tool B is supposed to populate first.
- Shared state mutation. Two tools do read-modify-write on the same resource. Lost-update race condition.
- Execution timing dependency. Tool B's precondition is Tool A's side effect (create-then-update on the same row).
Apply the idempotency test before parallelizing: is the tool atomic, idempotent, and free of shared mutable state? Pass all three and parallelize. Fail any and use sequential execution or explicit DAG orchestration. Read-only operations (vector search, web search, database SELECTs) are almost always safe; write operations need explicit sequencing. See Tool design for tool-level idempotency patterns.
Perceived latency#
Now the part that costs nothing and recovers a surprising amount.
Perceived latency is the subjective experience of waiting, and it diverges from clock time through three psychological mechanisms.[11] When tokens stream incrementally, the brain registers the system as active rather than broken. When useful content appears partway through generation, the user starts reading and consuming value before the system finishes. Streaming creates a perceptual sense of agency that reduces frustration during identical objective wait times.
A streaming version of an AI product had 3.4x higher session length and 2.1x higher D7 retention compared to a non-streaming interface with equivalent total generation time.[12] Same wall-clock latency, different delivery, different product outcomes.
Three UX tools that pay for themselves:
- Skeleton states beat spinners. Render a message bubble outline the moment the user submits, before any token arrives. Skeletons feel about 20% faster than spinners for identical wait time because they set layout expectations and eliminate the cognitive shock of content materializing from nothing.[11:1]
- Context-aware progress messages beat generic "Thinking..." "Searching documentation" or "Analyzing 45,000 tokens of context" outperforms an animated ellipsis because it anchors the user's expectations. They tolerate a longer wait when they understand why.
- Inter-token jitter is worse than uniform slowness. A 200 ms TTFT with occasional 200 ms ITL spikes feels worse than a 400 ms TTFT with smooth 30 ms ITL. Track ITL P99 separately from TTFT.
Streaming is the default for interactive UI, but it has one important exception. Streaming commits the UI to rendering in-progress output. If the model generates a confidently-worded wrong first paragraph, the user reads it before the model corrects itself. For structured outputs (JSON, code, anything that needs to pass a schema check before being useful), the right pattern is: stream to a hidden buffer, validate, then reveal. Or use constrained decoding (vLLM guided generation, Outlines) that bakes the schema into generation.
For the SSE wire format and the partial-rendering primitives, see Streaming. This chapter's job is the perception angle; that chapter's job is the protocol.
Putting it together#
The pattern across this whole chapter is the same: don't treat latency as a single number, and don't treat the median as the metric. The user experiences the tail. The user experiences TTFT, not throughput. The user experiences blank screens as broken systems, not slow systems.
The optimization order, in payoff descending: enable prefix caching and verify the hit rate; parallelize independent tool calls and check coupling; size capacity against P99 at peak concurrency; use streaming with skeleton states for any interactive UI; route to a fast provider for the UX classes that demand it.
What this chapter doesn't cover: how you ship those changes safely once you've made them. That's Shipping changes.
References#
Mitrasish, "LLM Inference SLO Engineering: TTFT, ITL, and P99 Latency Budgets for Production AI", Spheron, May 2026, https://www.spheron.network/blog/llm-inference-slo-ttft-itl-latency-budget-guide-2026/ ↩︎ ↩︎ ↩︎ ↩︎
Veraj Paruthi, "How input token count impacts the latency of AI chat tools", Glean engineering blog, July 2024, https://glean.com/blog/glean-input-token-llm-latency ↩︎
Jakob Nielsen, "Response Times: The 3 Important Limits", Nielsen Norman Group, 1993, https://www.nngroup.com/articles/response-times-3-important-limits/ ↩︎
Tian Pan, "TTFT Is the Only Latency Metric Your Users Actually Feel", TianPan.co, April 2026, https://tianpan.co/blog/2026-04-16-streaming-ttft-latency-perception ↩︎ ↩︎
Digital Applied Team, "AI Model Latency Benchmarks 2026", April 2026, https://www.digitalapplied.com/blog/ai-model-latency-benchmarks-2026-ttft-throughput ↩︎ ↩︎ ↩︎
Veraj Paruthi, "How KV caches impact time to first token for LLMs", Glean engineering blog, July 2024, https://glean.com/blog/glean-kv-caches-llm-latency ↩︎
Tian Pan, "LLM Latency Decomposition: Why TTFT and Throughput Are Different Problems", TianPan.co, March 2026, https://tianpan.co/blog/2026-03-10-llm-latency-decomposition-ttft-vs-throughput ↩︎
Tian Pan, "Parallel Tool Calls in LLM Agents", TianPan.co, April 2026, https://tianpan.co/blog/2026-04-10-parallel-tool-calls-hidden-coupling ↩︎
Boming Zhang et al., "An LLM-Tool Compiler for Fused Parallel Function Calling", arXiv:2405.17438, 2024, https://arxiv.org/html/2405.17438 ↩︎
Anthropic, "Parallel tool use", platform documentation, 2026, https://docs.anthropic.com/en/docs/agents-and-tools/tool-use/parallel-tool-use ↩︎
Tian Pan, "The Latency Perception Gap: Why a 3-Second Stream Feels Faster Than a 1-Second Batch", TianPan.co, April 2026, https://tianpan.co/blog/2026-04-20-latency-perception-gap-ai-interfaces ↩︎ ↩︎
KindaTechnical, "Streaming for Better Perceived Latency", April 2026, https://www.kindatechnical.com/claude-ai/streaming-for-better-perceived-latency.html ↩︎